

In 2009, Dairy UK, the milk processor body, set up an industry initiative with stakeholders from the dairy industry called Action Johne's. All UK dairy farms have a single supply contract with a designated buyer, who has control over the standards to which the milk is produced. This has progressed over the years from a Johne's disease (JD) education and engagement programme to a more structured framework for the control and management of JD in the UK dairy herd called the National Johne's Management Plan (NJMP) (Orpin, 2020a).
In 2017 the scheme structure involved the training of approved JD advisors through the British Cattle Veterinary Association and a campaign through the milk buyers to ensure their farmers had undertaken an annual risk assessment in conjunction with a trained and accredited JD veterinary advisor, and selected an appropriate control strategy from six possible options. The UK national farm assurance programme (Red Tractor) incorporated the NJMP into the dairy farm standards in 2020, effectively making it mandatory to be part of the NJMP, resulting in 95% of all UK dairy farmers now being included in the scheme, and over 1700 veterinary surgeons now trained to deliver on the programme.
Individual retailers have introduced their own maximum JD prevalence levels, which the farmer must achieve to retain his/her direct supply contract.
The NJMP programme has been phenomenally successful in terms of providing a framework for widespread engagement. The main costs of implementing the programme have been born by the farmers and milk buyers, and indirectly by the milk market. There has not been any state involvement.
The challenges with Johne's disease control in established programmes
Since the advent of the NJMP programme in 2009, Johne's knowledge has increased. There is now a greater emphasis placed on dam associative risks (Whittington and Windsor, 2009; Patterson, 2020; Taniguchi, 2021) and calf to calf transmission (Corbett, 2017). The retention of persistently infected animals that are allowed to calve again will significantly increase both the risk of in utero transfer of infection and dam-associative risk as cows enter the latter stages of the disease. The relative importance of these alternative routes of exposure increases once the major risks are controlled.
Many herds are testing for JD regularly, but progress has not been uniform across all herds. The reasons for these differences relate to a wide range of factors, such as the level of veterinary/farmer engagement, understanding, farmer beliefs, resources and priorities (Ritter, 2016). The ability to engage and motivate farmers is vital for delivery of effective JD control. Testing without actions is not enough.
A survey of 394 farmers' attitudes to the NJMP (Orpin, 2017) showed that farmers were uncertain about which cows to cull, how to manage test interpretation around tuberculosis tests, and difficulties segregating cows. The farmer requires help to ensure that these key risks are managed effectively.
Further detailed analysis utilising the Myhealthyherd program in over 100 herds using the National Milk Records JD program (Herd-wise) clearly showed that in over 40% of herds regularly testing, the risks of transmission were not adequately controlled (Karen Bond personal communication).
The practical steps to reduce the risk within herd JD transmission through selective breeding, targeted culling, defining low risk times of year to source replacements, and more detailed JD management planning has been highlighted (Orpin, 2019, 2020b).
Results and challenges with the NJMP
The NJMP requires farmers to opt for one of six control strategies to manage JD on their farms. The ability to choose an appropriate control strategy to fit the farm has been crucial to the success of the programme. The choice is driven by prevalence, farmer aspiration and resources (Table 1).
Table 1. Strategy Control Plan Selection 2018–2020
| Strategy | Number of declarations 2018 | Number of declarations 2019 | Number of declarations 2019 |
|---|---|---|---|
| 1. Biosecurity protect and monitor | 304 | 324 | 549 |
| 2. Improved farm management | 135 | 135 | 296 |
| 3. Improved farm mangement and strategic testing | 1468 | 1727 | 2224 |
| 4. Improved farm management test and cull | 803 | 1001 | 1480 |
| 5. Breed to terminal sire | 204 | 256 | 638 |
| 6. Firebreak vaccination | 9 | 9 | 17 |
| Control strategy unknown by Action Group Johne's | 3161 | 2031 | 11 |
| Total number of declarations received | 6084 | 5483 | 5215 |
The main surveillance tool used to identify infection and to manage infected animals has been enzyme-linked immunosorbent assay (ELISA) testing of individual cow milk samples. Approximately 70% of herds are using regular individual cow milk ELISA testing within their control programmes, with around 42% using quarterly milk testing to identify and manage infected cows within their herds.
The Biosecurity Protect and Monitor programme, advised by many national JD schemes, is an unpopular choice for dairy farmers in the UK.
Measuring and managing progress
The NJMP currently can only track the strategy choice that farmers have taken. This is becoming an onerous burden on the processors. Most credible national programmes would have a method for assessing within herd prevalence or changes in risks as a measure of success. As nearly half of all farms in the programme are using one of three milk recording organisations to perform quarterly testing on milk samples from lactating cows in their herds (utilising the same IDEXX ELISA test) a decision was taken to focus on developing a tool (Johne's Progress Tracker) to monitor progress in the quarterly testing herds initially. The aim will be to extend the use of the outcome measures to other surveillance strategies, such as annual testing or random subset sampling.
Utilising risk management effectively
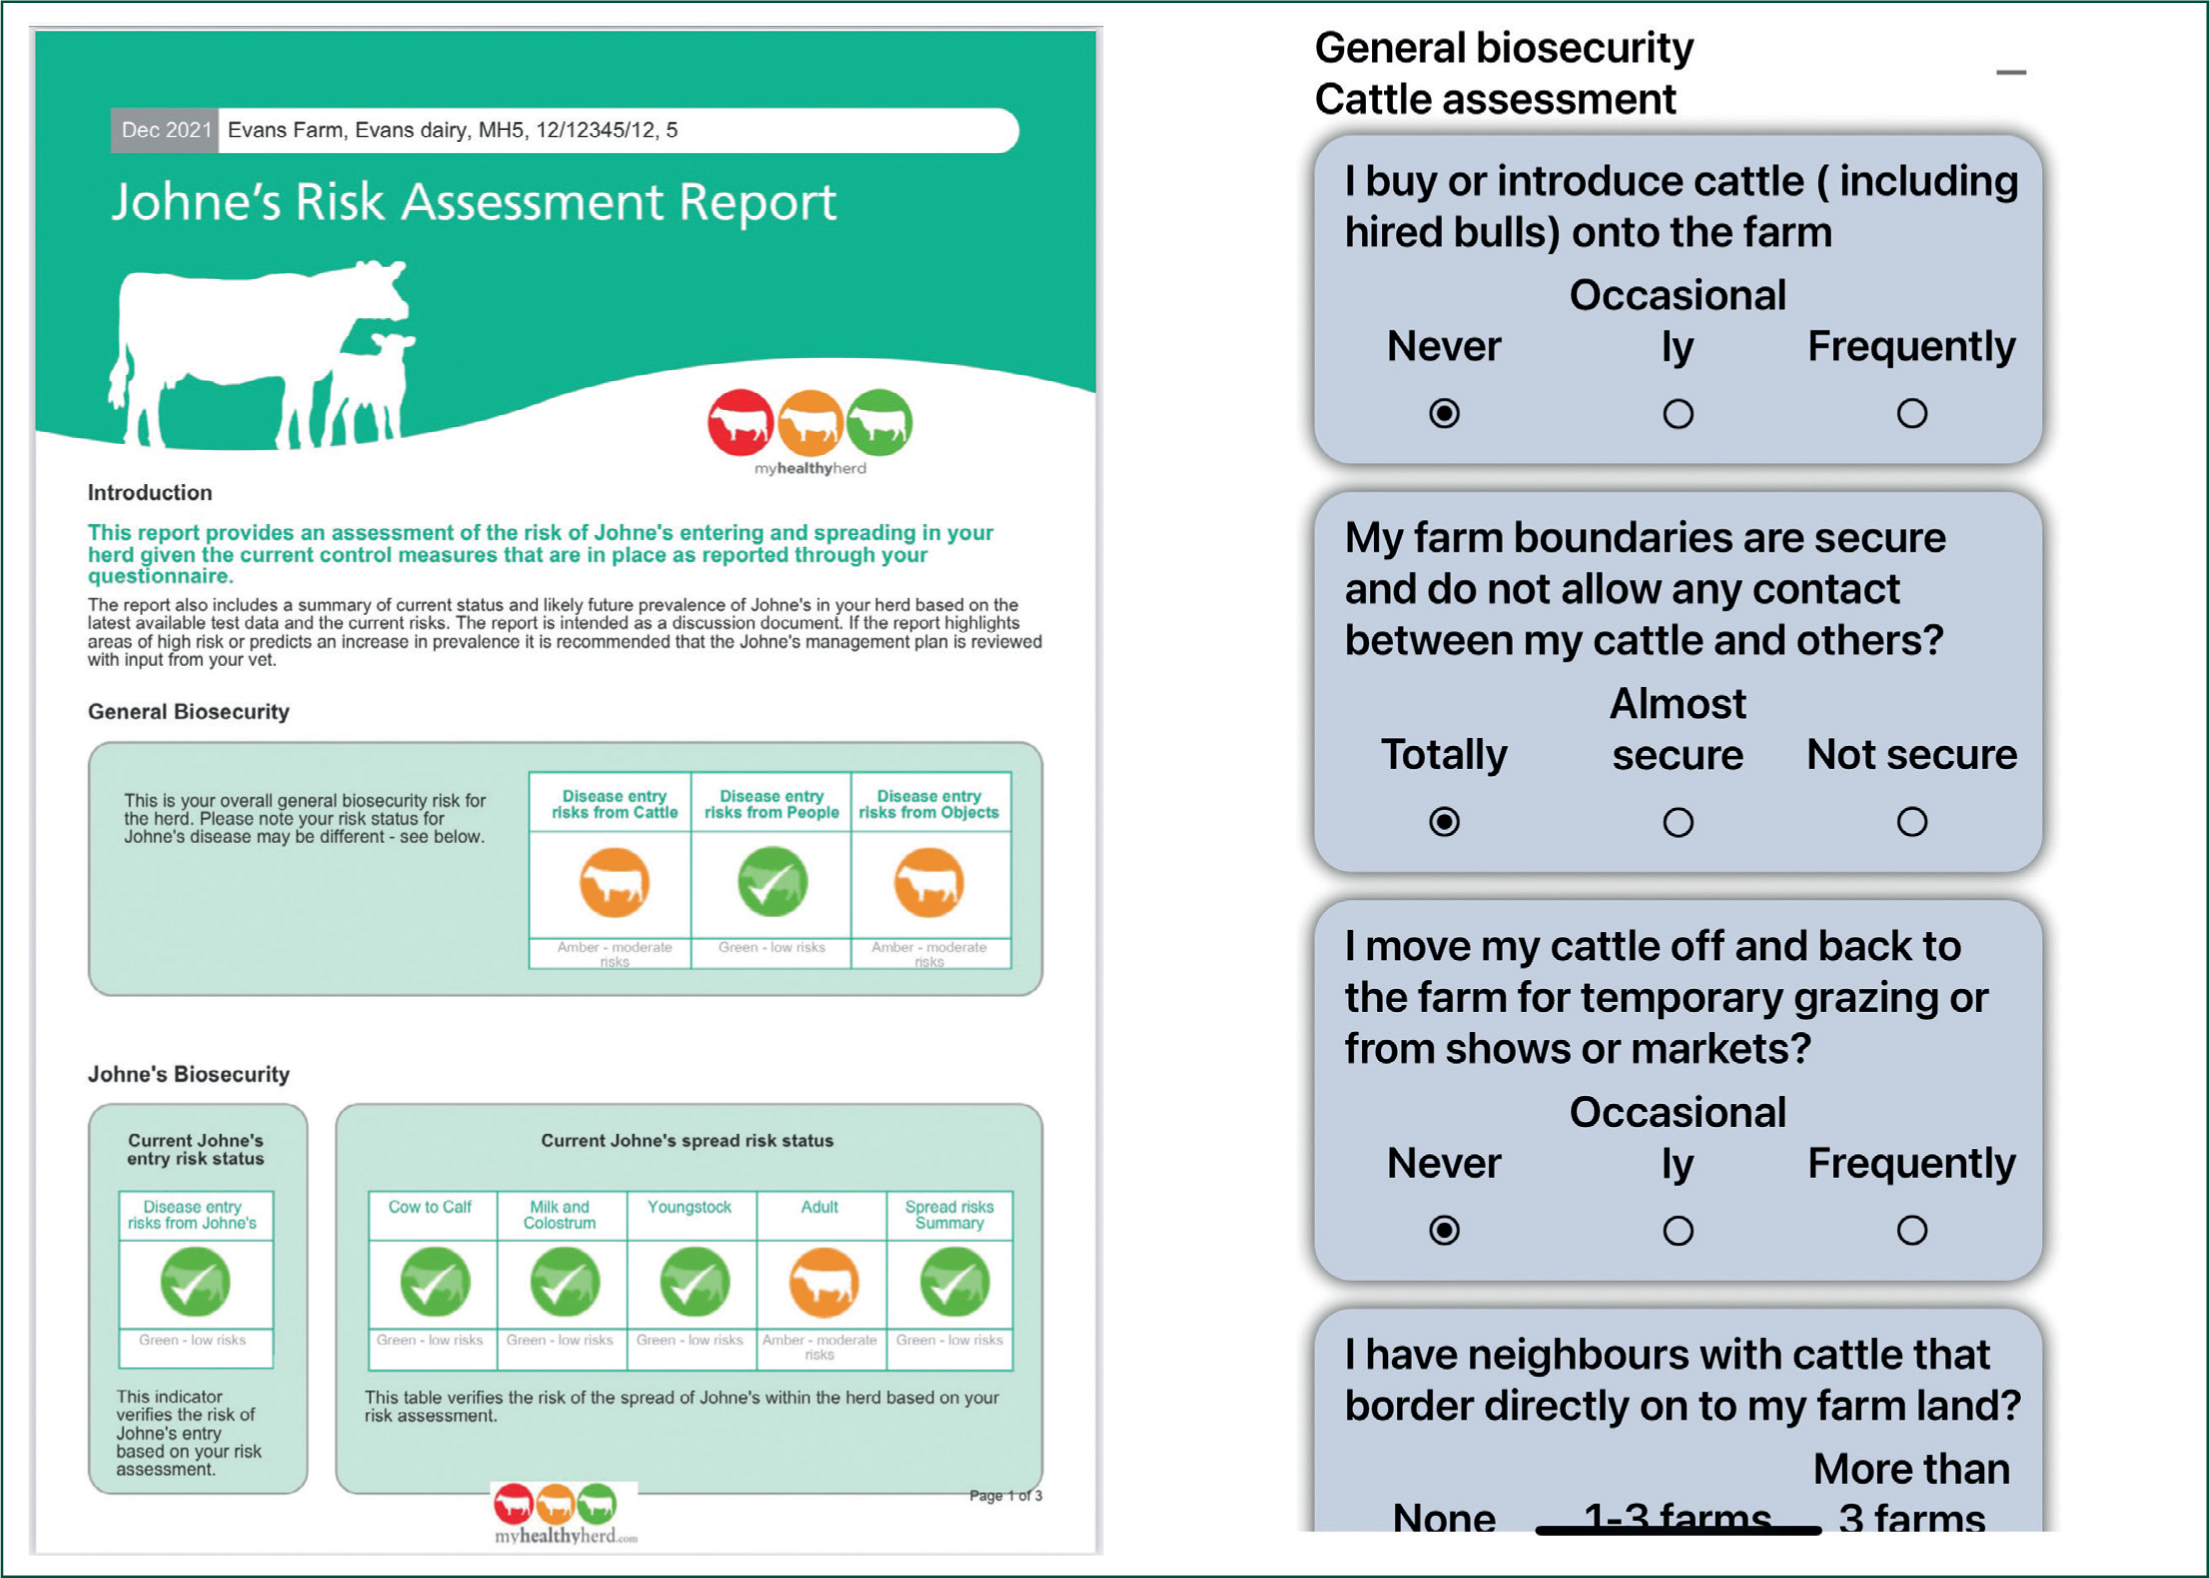
Biosecurity and biocontainment risk assessments are a prospective measure for future JD prevalence, whereas test results typically reflect the risks that were present 2–5 years earlier because of the long latent period between infection acquisition. The Myhealthyherd program has been utilised extensively in the UK within regional health programmes and veterinary practices to support proactive disease management. In December 2021 the risk assessment module has been enhanced to include the differing emphasis of risks and new knowledge. The risks are then traffic scored and any areas of concern highlighted. The program now has the capability to be used as an App on a phone/tablet on farm to undertake risk assessments and create control plans. An essential part of the NJMP is the demonstrable ability to review risks every year to ensure that the farmer remains on track to reduce the risk of JD. Ensuring a detailed risk assessment and control plan is created is essential for success, for example Myhealthyherd shown in Figure 1.
Development of the Johne's Progress Tracker
Dairy UK and AHDB commissioned research by the Veterinary Epidemiology and Economics Research Unit (VEERU; Reading University) lead by Nick Taylor in combination with the Action Group Johne's aimed to identify potential outcome and driver measures to track JD progress. This work built on some preliminary work within the Park Vet Group by the author utilising spreadsheet analysis.
The Stage 1 study utilised retrospective data extracted from 39 herds over 652 test dates between January 2015 and March 2020, 157 985 test results.
A wide range of parameters were examined, and the following were the most useful:
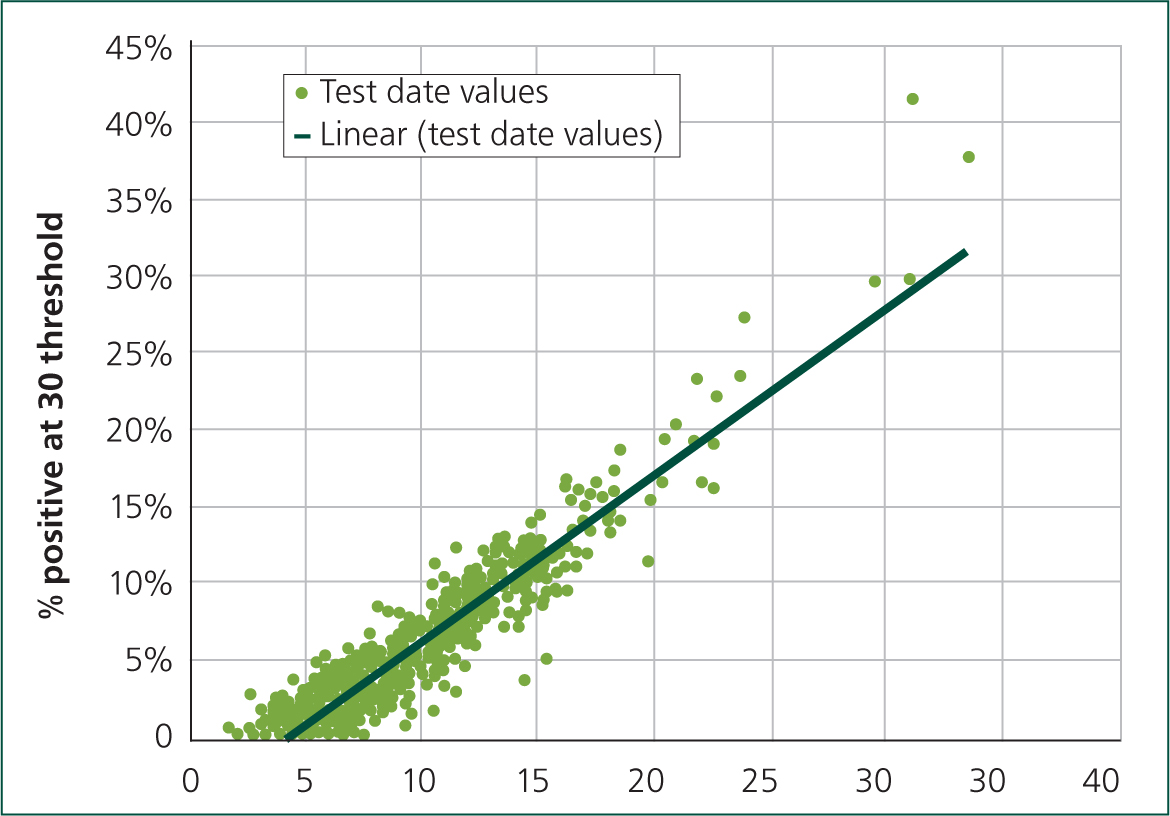
- The final chosen outcome measures were the average test value (ATV) (arithmetic mean of all test results of a whole milking herd screen), % positive over 30, 60, 100 values (30 = positive cut point, 60 indicates entry into progression, 100 = heavy shedding risk)
- The ATV was strongly correlated to the % test positivity. (R2=0.87) at the positive (30) threshold (Figure 2)
- The benefit of utilising the ATV was this measure incorporated all test results within the herd. The ATV includes those animals that are inconclusive and takes into account the magnitude of the cows testing positive, allowing for a more nuanced interpretation of the JD status.
The drivers of the average test value
The drivers to infection within the herd are related to new detections, persistence, removal rate and disease pressure (breeding from known test positive JD cows) (Figure 3).
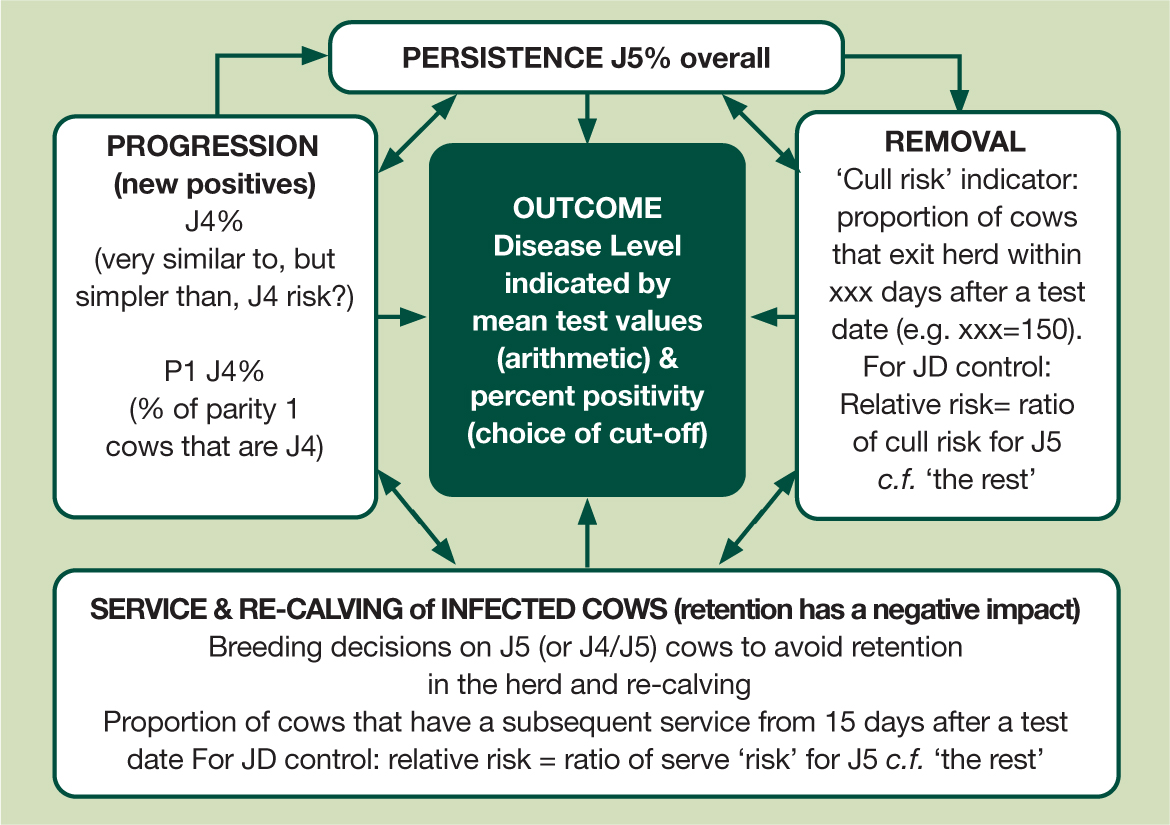
The four drivers defined that had the greatest influence on the ATV were two retrospective indicators (% of cows testing positive for the first time, new detections J4%, and % of cows with two tests out of four consecutive tests that are positive, J5% persistence). These measures indicate the historic levels of infection in the herd 3–4 years earlier.
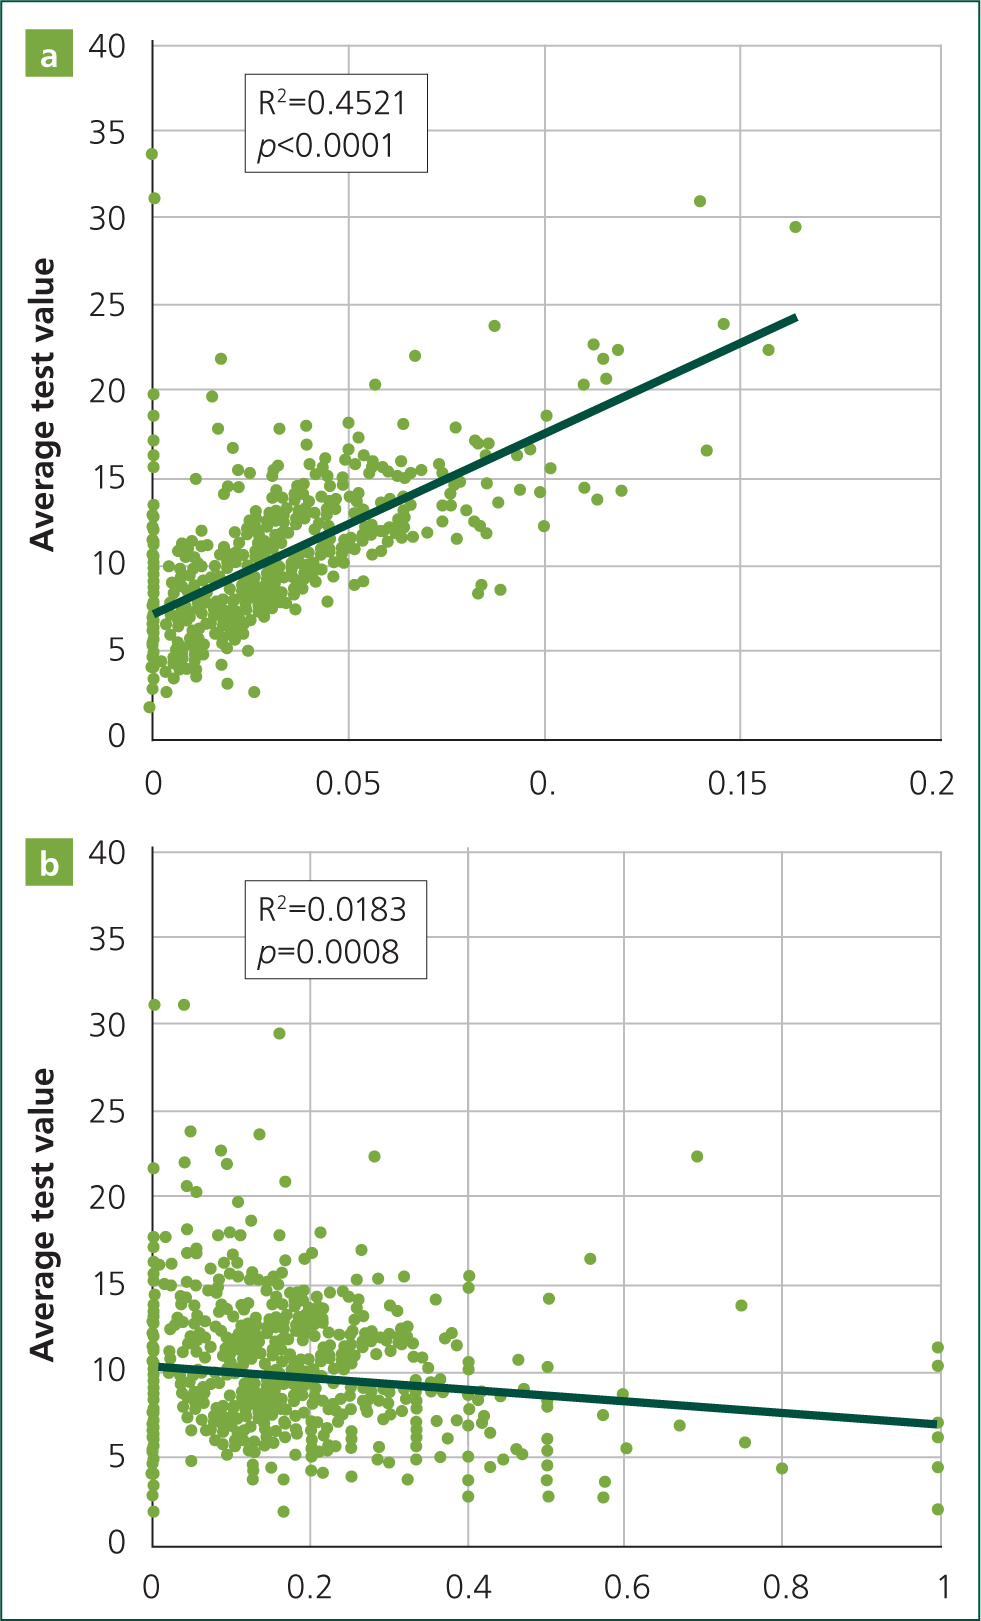
As might be reasonably expected, the rate of new detections (J4 risk) has a strong association with mean test value (R2 0.4521; p<0.0001), with increased J4 risk linked with increased ATV (Figure 4). Also, as might be expected, the rate of removal of positive cows (J4/5 cull risk/cohort incidence) has an association with ATV, with increased J4/5 cull risk linked with decreased arithmetic mean test value. This association is weaker (R2 0.0183) but statistically significant (p=0.0008).
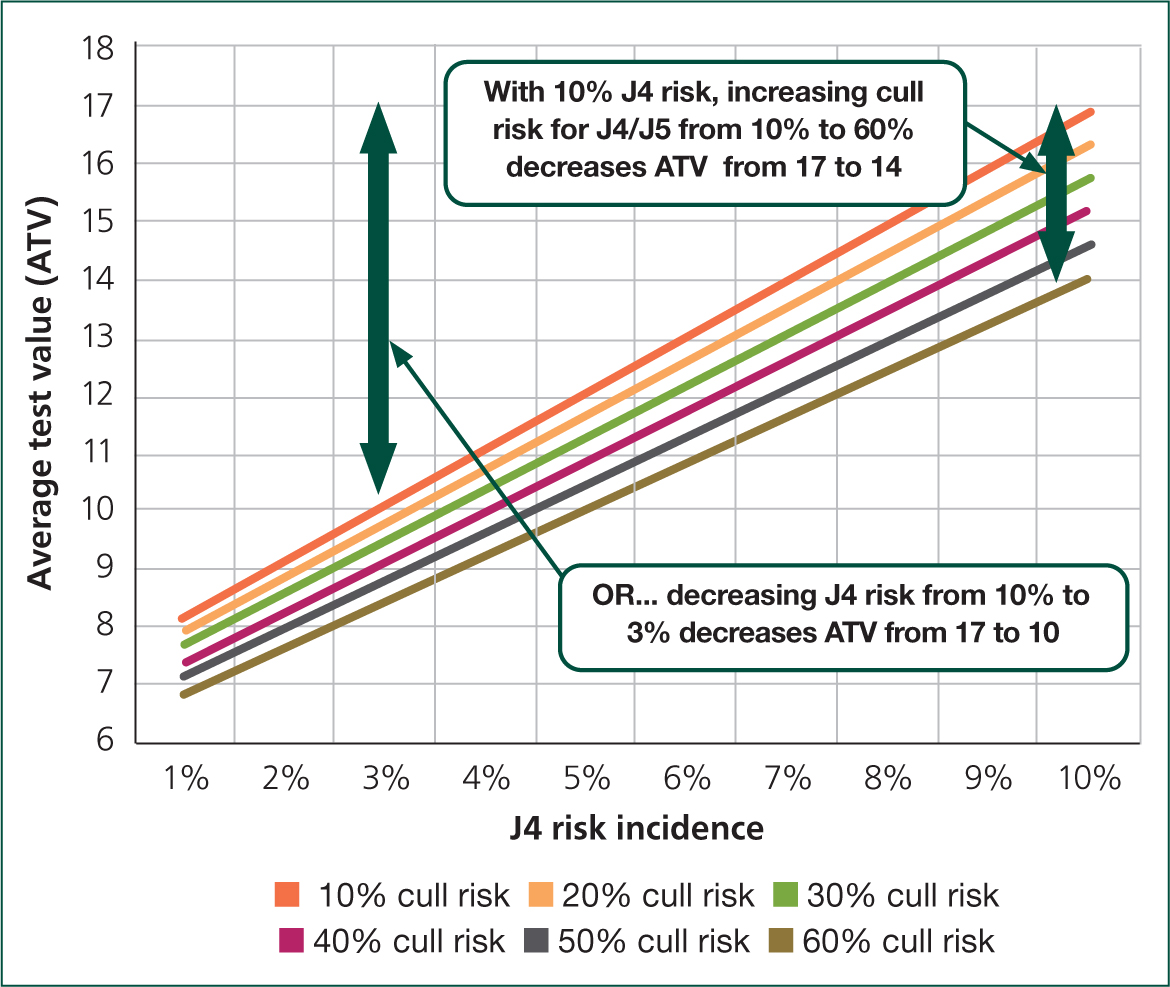
A linear mixed effect, multi-level model, including ‘herd’ as a random effect, was used to further analyse the possible impact of these two factors on mean test value. The output of this statistical model is used to show the combined effect of controlling J4 risk and culling J4/J5 cows on ATV (Figure 5). The ranges of J4 risk and J4/5 cull risk used are compatible with the ranges found in the study population, where the range from 5th percentile to 95th percentile (i.e. the middle 90%) was from 0.6 to 8.5% for new J4 risk and from 0 to 47% for J4/J5 cull risk. In essence, to control the ATV effectively, culling alone will not be cost effective if risks of new infection are not controlled.
The contemporary drivers are the relative risk of removal of J5 cows from the herd compared with non-affected (negative) cows and the relative risk of serving J5 cows. These drivers appear to be reasonably good indicators for good management decisions to promote JD control. Farmers that commit to not serving JD cows and culling appropriately tend to have effective control programmes. Those that cull but do not control persistence or new detections are less effective at controlling the disease.
Benchmarking and development of quartile ranges
A subset of an existing database of 500 randomly selected National Milk Recording herds was used to develop a set of benchmark JD parameters against which an individual herd's parameters could be compared. The benchmark parameters are based on each herd's test results in the calendar year 2020. To qualify for the benchmark subset, herds must have at least seven whole herd milk JD tests in the 2-year qualifying window (in this case 2019 and 2020). 253 herds met the criteria. The intention is to update the benchmark every 1 or 2 years.
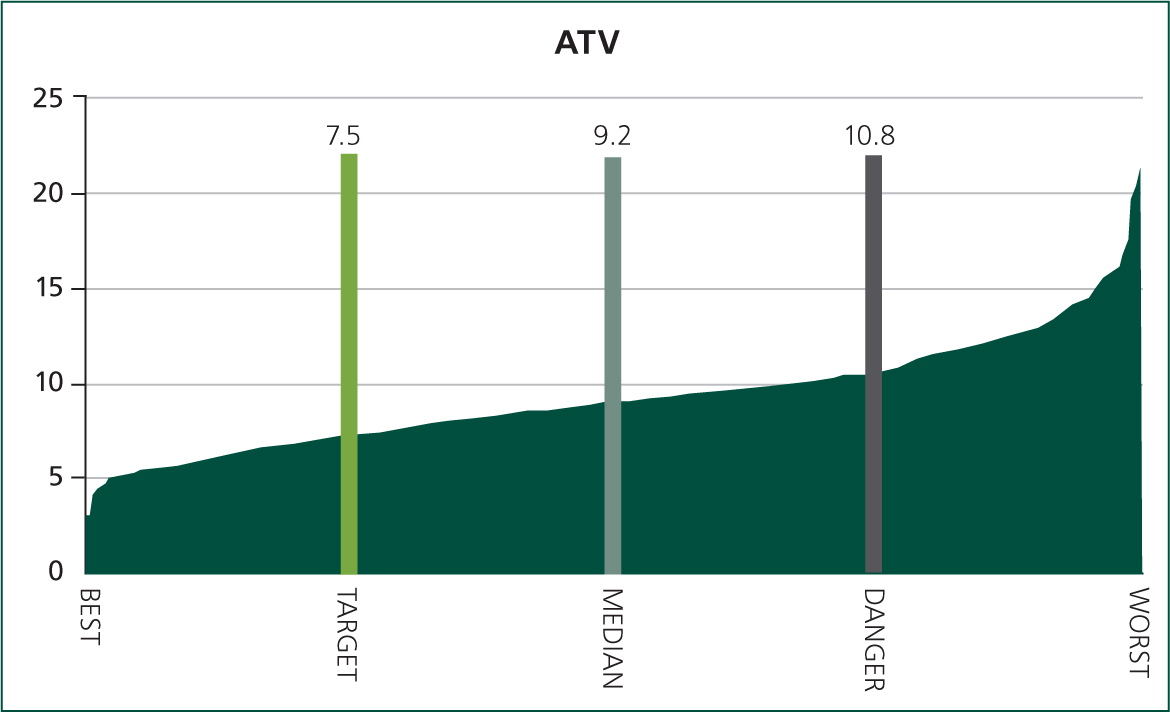
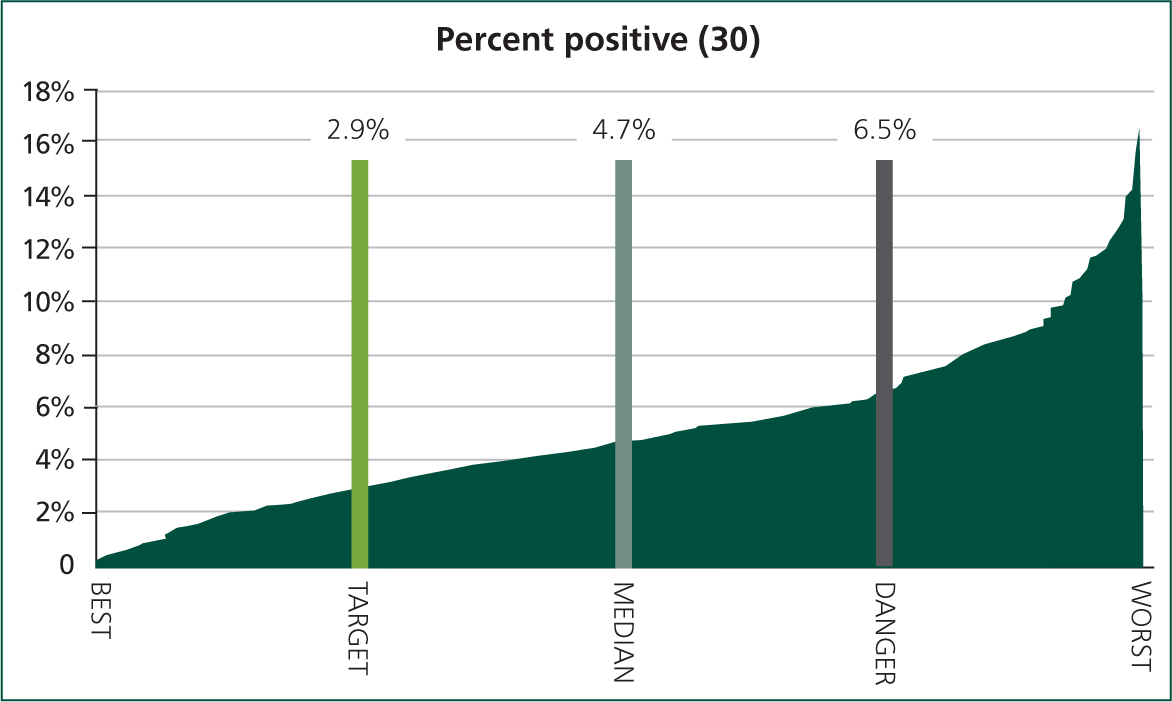
The key outcome measures of ATV and % positivity show similar distributions. In the worst affected herds infection can progress out of control with the ATV exceeding 15 and test positivity greater than 12% (Figures 6 and 7). The ‘danger’ and ‘target’ limits are based on the 1st and 3rd quartiles of each parameter, showing the values delimiting the ‘best’ and ‘worst’ performing 25% of the 253 herds. Individual herds can use these benchmarks to see how their own JD parameters compare with the best 25%, middle 50% or worst 25%.
The Johne's Progress Tracker
The Johne's Tracker program was launched in July 2021. Interherd (PAN livestock Services) have already developed a fully working program that allows analysis of any herd irrespective of the milk recording agency. This work was driven by Dr James Hanks and Andrew James who worked through the coding to deliver a practical workable product. The Interherd+ program has been used as the beta testing platform for the JD Tracker. The Milk Recording Organisations (National milk records (NMR), cattle information service (CIS)) and Totalvet have developed similar software for farmer and veterinary access.
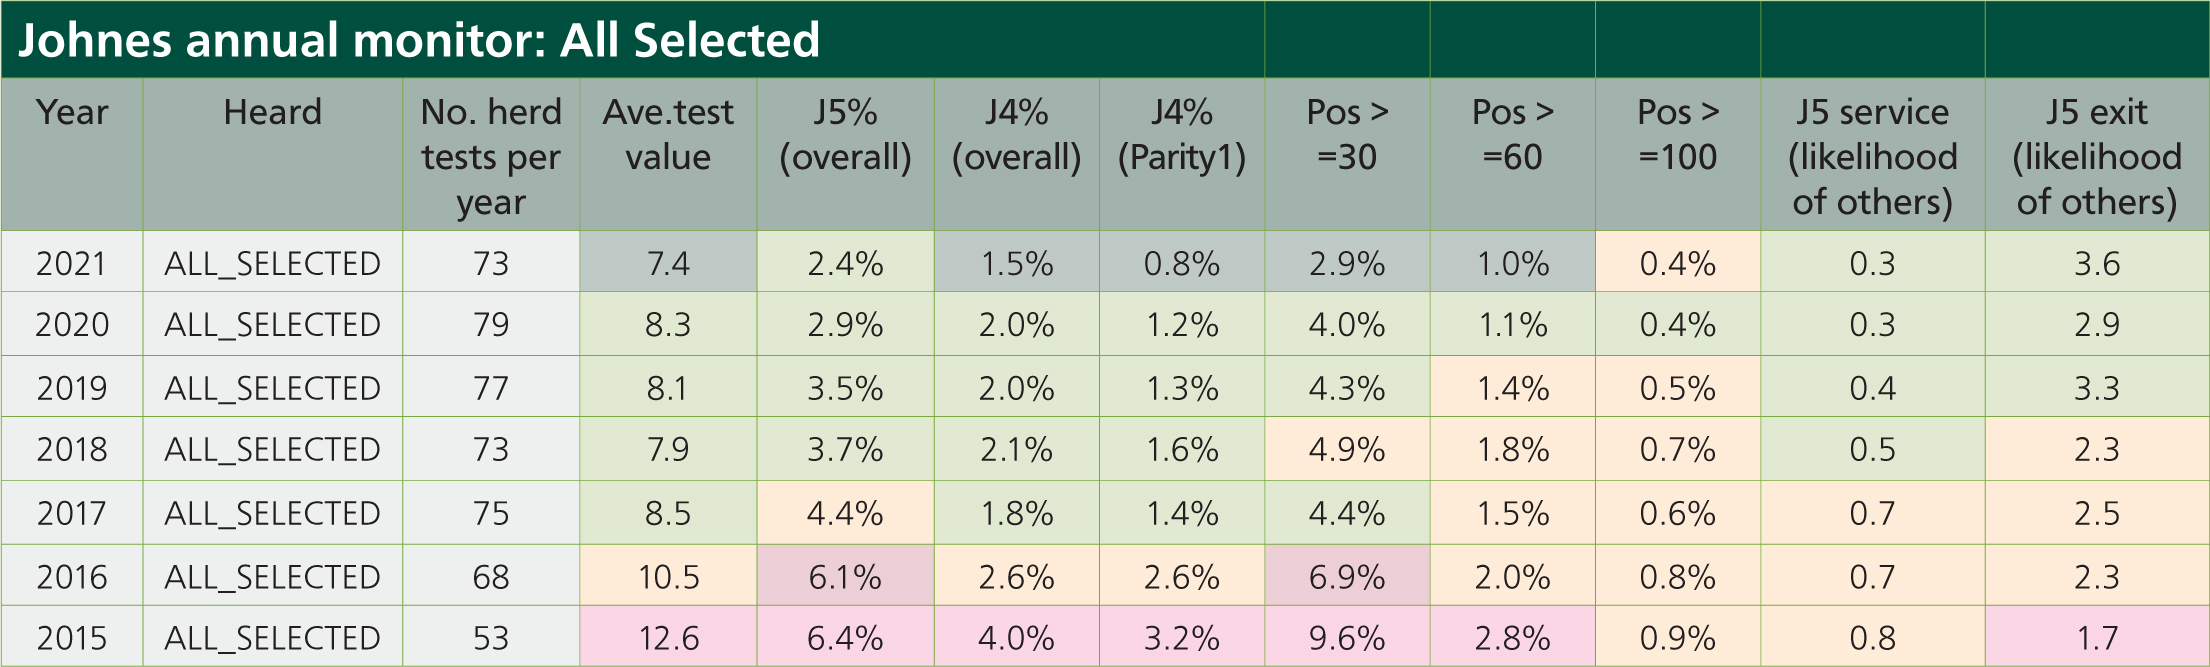
Individual herd's results are compared against the quartiles in the benchmark dataset and their position relative to the benchmark quartiles is illustrated by colour coding as follows:
- Darkest green = best quartile
- Lighter green = median to best quartile
- Amber = median to worst quartile
- Pink = worst quartile
The output tables can quickly be visually scanned to assess the outcomes and then further analysed to assess the drivers.
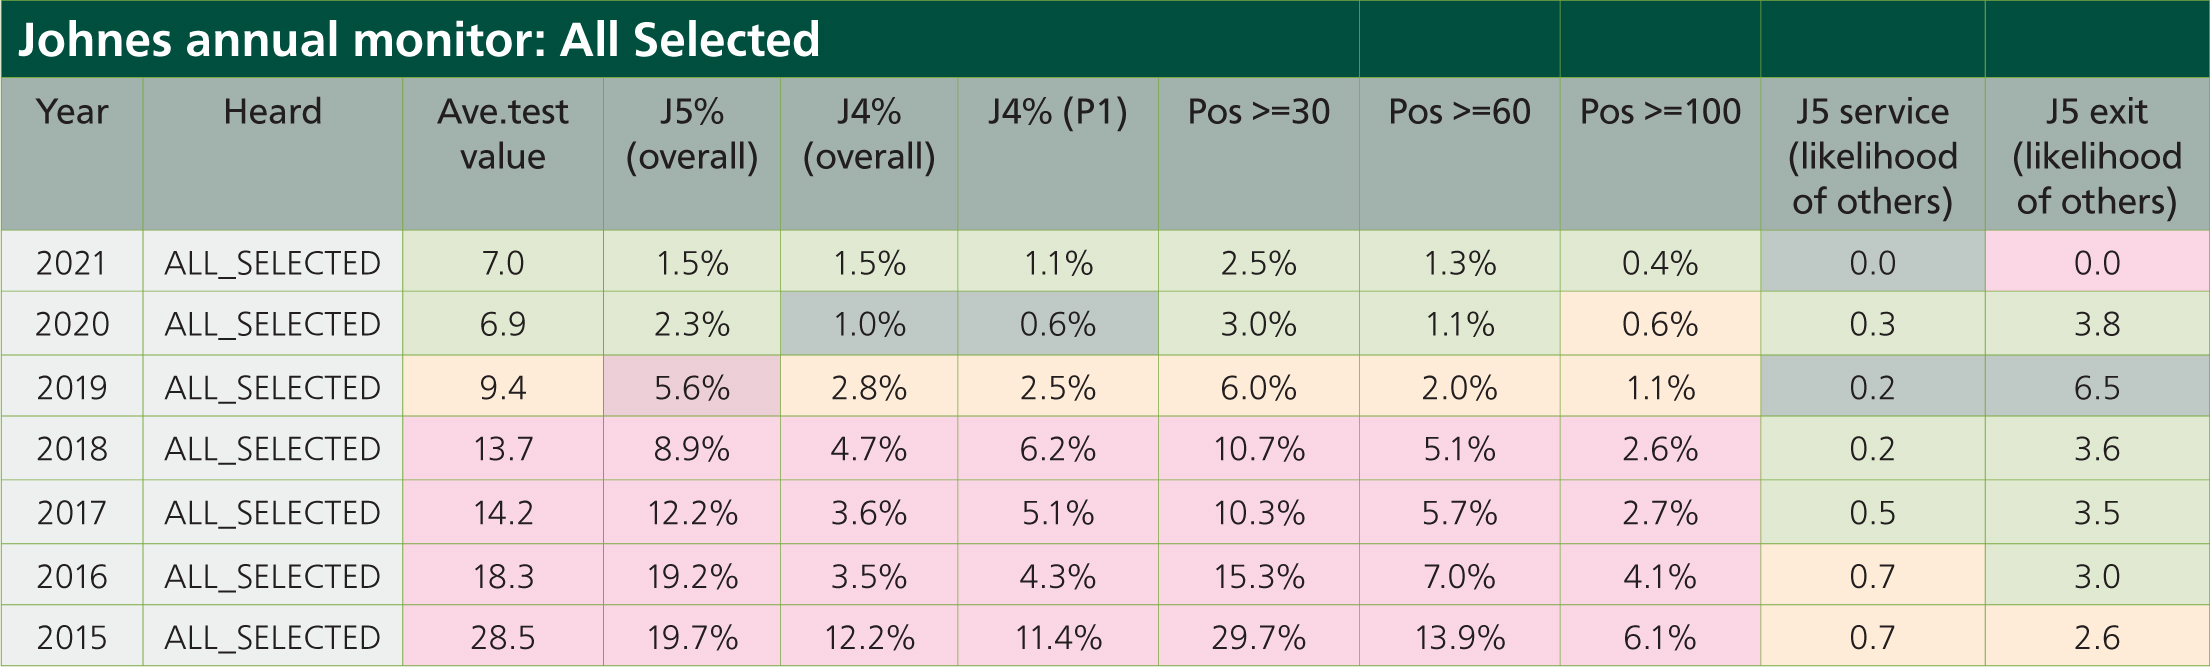
In the herd illustrated in Figure 8 the farmer with expert help from their veterinary surgeon adopted a robust control programme involving the use of selective breeding with sexed semen to secure replacements from low risk breeding stock, utilised proactive culling and modifications to maternity and calf management to reduce risk of spread with the herd. A robust plan for each infected cow was adopted where cows were not served, bred to terminal sire or culled promptly. New infections were controlled by improved hygiene and early removal of calves. In addition, all test positive cows and their offspring were tagged, separated, and not used for breeding replacement stock. The J4% or risk of new detections reduced from 12.2 to 1.5% over 7 years. The disease pressure was reduced by reducing the risk of serving J5 cows and therefore increasing the risk of removal of the most high risk cows.
The table is further supported by graphs of specific parameters and more detailed analysis of individual milk recordings. More detailed analysis of other reproductive and health parameters for each JD category is possible within the Interherd+ program.
The same methodology can be utilised to examine progress at group level. Within the same veterinary practice consistent improvement was achieved in over 65% of herds with a halving of test positive rate (Figure 9).
Conclusions
In the last 4 years there has been a change in our understanding as to the most important risks for controlling JD. The relative risks of spread within a herd will change over time, once the major risks of transmission are controlled. For effective control a comprehensive risk assessment must be undertaken that manages all risks (cow to calf via environment, dam associative and calf to calf risks). Control plans need to be bespoke, practical, and targeted.
The JD Tracker project has provided new insights into an old disease. The presentation of data in a more accessible way is allowing veterinary surgeons and farmers to have more focused discussions and learn from past mistakes. The reports provide a strong motivator for farmers by showing the success that has been achieved.
Early experiences show that the commonest mistake is an over reliance on culling without reducing the new detection rate (J4%) in all cows or parity 1 cows.
Failure to cull effectively and promptly results in an increase in persistence (J5%), and the herd biocontainment measures become overwhelmed by the level of MAP within the herd.
The Johne's Progress Tracker and risk assessments are tools to help facilitate veterinary consultation. There is no substitute for expert veterinary guidance.
KEY POINTS
- The National Johne's Management Plan (NJMP) provides a framework for Johne's control in dairy herds.
- The NJMP is now a compulsory part of Red Tractor Farm assurance and 95% of dairy farms require to undergo a risk assessment, surveillance and have an up-to-date written Johne's disease (JD) control plan.
- A Johne's Progress Tracker tool has been developed which allows tracking of JD outcome measures and drivers for quarterly milk tested herds.
- Effective JD control requires more than just reactive culling. Risks of within herd spread must be managed for sustainable management and are often overlooked.
- Risk management tools should include management of dam associative and calf to calf routes of infection for effective control in established JD control plans.
- More effective tools are available now to both assess risk and identify gaps in existing JD plans (Myhealthyherd, Interherd+, Herdwise, Totalvet, CIS).