
Analysis of data using software and the understanding of mastitis epidemiology on farm remains a barrier to more widespread control of mastitis in the UK for several reasons. Data analysis requires time, either on farm with the client or off farm at the practice. Routine analysis of data requires available software and interpretation of the data requires an understanding of fundamental concepts in epidemiology as well as understanding of the research into mastitis infections and mastitis control.
Analysis of mastitis data is an essential first step in any mastitis investigation, including the Mastitis Control Plan because any control measures that are prioritised to the farmer are dependent on a correct interpretation of mastitis patterns at this point. Research has shown that a targeted approach to control rather than a ‘one size fits all’ approach is vital when working to reduce the rate of new infection (Green et al, 2007), and therefore mastitis control plans have to be specifically tailored to the present herd situation. This represents a key barrier that prevents mastitis control being more successful and there continue to be many examples of where mastitis control advice has become confused and ineffective in the absence of a clear herd pattern.
A mastitis pattern analysis tool was developed to assist the Mastitis Control Plan deliverer in the field to arrive at a likely herd pattern rapidly, requiring minimal extraction of data from existing dairy herd analysis software packages (Breen et al, 2017). In addition, herds with robust on-farm data could routinely ‘drop-out’ information into the herd mastitis pattern analysis tool and refine ongoing control measures accordingly. This pattern tool became the first step in a new mastitis control scheme for the UK, called ‘QuarterPRO’ (Green et al, 2018). However, this pattern analysis tool highlighted the need for robust data; herds with infrequent or absent milk recording data and/or missing clinical mastitis event data would not be able to take advantage of this process.
The mastitis pattern analysis report
Recently, work published at University of Nottingham has used machine learning to improve the original mastitis pattern analysis tool and has refined the algorithms used (Hyde et al, 2020). The pattern analysis report used data from 1000 farms and random forest algorithms to replicate the herd level diagnoses previously made by specialist veterinary surgeons with a high degree of accuracy. The work reported an accuracy of 98%, positive predictive value (PPV) of 86% and negative predictive value (NPV) of 99% for the diagnosis of a herd mastitis ‘contagious’ infection pattern versus a herd mastitis ‘environmental’ infection pattern, and an accuracy of 78%, PPV of 76% and NPV of 81% for the diagnosis of a herd mastitis ‘dry period origin’ infection pattern versus a herd mastitis diagnosis ‘lactation origin’ infection pattern.
The pattern analysis report is now fully automated and available online. The project to develop the new automated service was a collaboration between the University of Nottingham, QMMS, CIS, NMR and Vet Partners. The development was supported by funding from the Biotechnology and Biological Sciences Research Council (BBSRC) and the Agriculture and Horticulture Development Board (AHDB) Dairy and utilises the REMEDY Platform being developed by QMMS and the University of Nottingham, with funding from Innovate UK. Dairy producers with full milk recording data can sign up free of charge using a cloud-based service to receive the mastitis pattern analysis report automatically after each recording (https://cloud.remedy.farm/mpat).
The report also provides an assessment of data quality. In order to be confident in the diagnosis, it is important to have regular milk recording, calving and mastitis event data. Ideally farms would be milk recording every month, but bimonthly recording is unlikely to impair the pattern diagnosis. It is essential that clinical mastitis cases and calving dates are registered with the milk recording organisation.
Using somatic cell count data for pattern analysis: fundamental concepts
The mastitis pattern analysis report relies on individual somatic cell count (SCC) data, just as the veterinary advisor relies on this data to make decisions on likely origin of infection and therefore where to prioritise control measures. A useful review of the use of SCC data can be found elsewhere (Bradley and Green, 2005; Bradley et al, 2007). Fundamental concepts around the use of SCC data to understand mastitis epidemiology are:
- When new high-count infections tend to occur (i.e. between drying-off and the first recording post-calving or between consecutive milk recordings in lactation)
- The rate of new high cell count infections (i.e. cows that are moving from ≤200 000 cells/ml to >200 000 cells/ml)
- The impact of new infections in heifers (i.e. first lactation SCC >200 000 cells/ml for the first time, particularly at the first milk recording post-calving)
- The effect of seasonality in new infections
- The cure rate for high cell count cows across a dry period (i.e. >200 000 at the end of the previous lactation but ≤200 000 cells/ml at the first recording post-calving)
- The impact of legacy infections on the current population of high SCC cows (i.e. the percentage of high SCC cows from any milk recording that have the origin of that infection in either the previous lactation or current lactation; what proportion of ‘today's’ infected cows are a result of ‘carry-over’ from a previous lactation infection
- The pattern of chronic high SCC cows against the overall prevalence of high SCC cows.
Using clinical mastitis event data for pattern analysis: fundamental concepts
The mastitis pattern analysis report also relies on clinical mastitis (CM) event data, just as the veterinary advisor would also require information on clinical cases of mastitis that have been detected in the parlour and reported prior to treatment to make decisions on likely origin of infection. For many herds, this information continues to be difficult to obtain, either because of a lack of belief about what ‘clinical mastitis’ is (i.e. failing to report mild cases where there are changes to the milk only) and/or because of a lack of a robust reporting system whereby CM events find their way to an electronic database and on to the milk recording organisation. It is essential that all cases of mastitis are recorded, not simply cases treated. Fundamental concepts around the use of clinical data to understand mastitis epidemiology are:
- When first CM events are occurring (i.e. within 30 days after calving or after 30 days in lactation). This is a basic requirement for any analysis and monitoring of clinical mastitis as this provides information regarding likely dry period epidemiology (Green et al, 2002)
- The rate of first CM events (i.e. are more than 1 in 12 cows affected within 30 days post-calving)
- The impact of first CM events in heifers
- The effect of seasonality in first CM events
- The cure rate for first clinical mastitis events (cure is defined based on SCC for the next three milk recordings, with no recurrence of clinical signs).
Targets have been described in previous publications (Green et al, 2002; Bradley and Green, 2005) and are shown in Table 1.
Table 1. Key udder health targets used for mastitis pattern analysis
| Type of data | Metric | Target |
|---|---|---|
| Clinical mastitis | Incidence | <25 cases per 100 cows per year |
| Dry period origin rate | <1 in 12 | |
| Lactation origin rate | <2 in 12 | |
| Somatic cell counts (SCCs) | Lactation new infection rate | <5% |
| Dry period new infection rate | <10% | |
| Fresh calver infection rate | <10% | |
| Dry period cure rate | >85% | |
| Prevalence of high SCC | <20% | |
| Prevalence of chronic high SCC | <5% |
This article uses case examples from commercial herds to highlight an environmenal lactation origin infection pattern (Box 1) and an environmental dry period origin pattern (Box 2) (farm information has been anonymised).
Box 1.Example lactation origin infection patternThis example report is for a 230-cow Holstein Friesian herd, all year-round calving and averaging 9500 litres.Mastitis pattern analysis report shows high probability that predominant infection pattern is one of ‘environmental lactation’ period origin (Figure 1).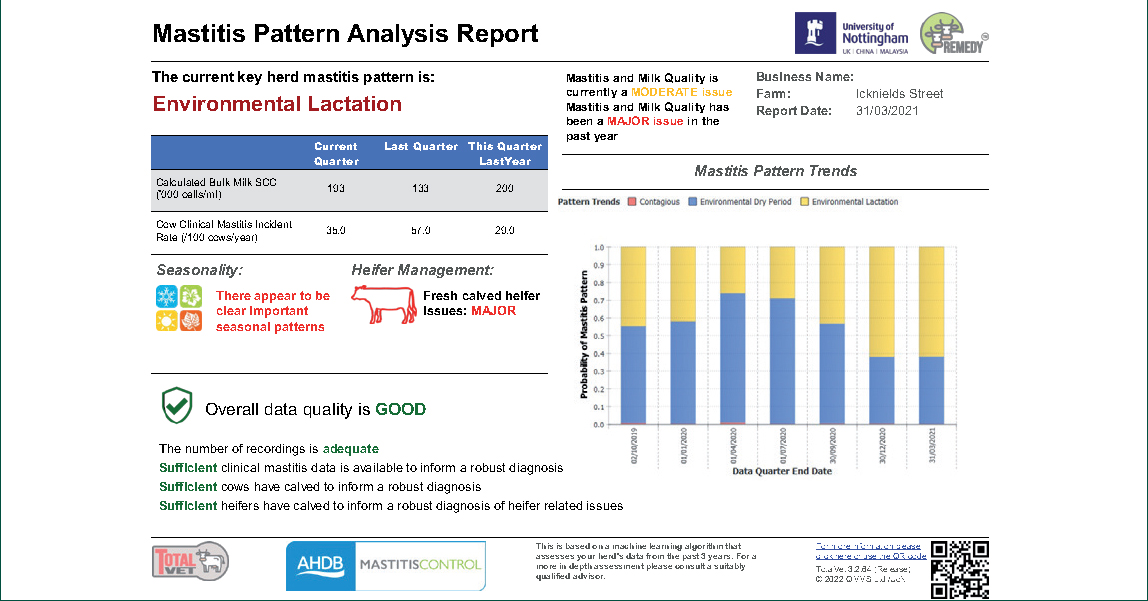
Figure 1. Mastitis pattern analysis report.
More in-depth analysis shows:
- Data quality is good — three milk recordings each quarter, sufficient calving records and clinical mastitis event data
- The current mastitis rate is high (35 cases per 100 cows per year) but was higher in the previous quarter (57 cases per 100 cows per year)
- Very good control of FIRST cases of clinical mastitis in cows less than 30 days in milk (0.4 cows in 12 cows affected, target <1 in 12)
- Clear seasonality in the rate of FIRST cases of clinical mastitis events, with a rise in the rate of first cases in cows >30 days in milk occurring in late summer and autumn months. During this period the average lactation origin mastitis rate is 4 to 5 cows in 12 (target <2 in 12) (Figure 2)
- Very low prevalence of cows >200 000 cells/ml, averaging 12% of cows >200 000 cells/ml in the last 12 months (target <20%)
- Bulk milk somatic cell count averages less than 200 000 cells/ml — this is a hallmark of environmental patterns
- More than 10% of heifers are recorded >200 000 cells/ml at the first milk recording post-calving — although this is a separate issue.

Figure 2. Rate of first clinical mastitis events >30 days in milk (lactation origin cases) (©TotalVet, QMMS Ltd). The orange zone represents the maximum advisable rate (MAR) set at no more than 2 cows affected for every 12 cows at risk between day 31 and day 305 after calving (i.e. cow-days of risk). Bars in the background plot the number of cows at risk, read to the right axis i.e. the number of cows between 31–305 days in milk, eligible for a case of mastitis. The green line shows the actual rate of first cases, read to the left axis.
A high rate of new cases, but low prevalence of high cell count cows suggests an environmental pattern of infection. Given that most clinical cases are occurring >30 days in milk, the lactating cow environment is likely to be important in the current outbreak. Common areas to address include building ventilation, bedding and slurry management, stocking density, pre-milking routine etc.
Box 2.Example dry period origin infection patternThis example shows the report from a 550-cow British Friesian cross herd, spring calving and averaging 5500 litres.The mastitis pattern analysis report shows high probability that the predominant infection pattern is one of environmental dry period origin (Figure 3).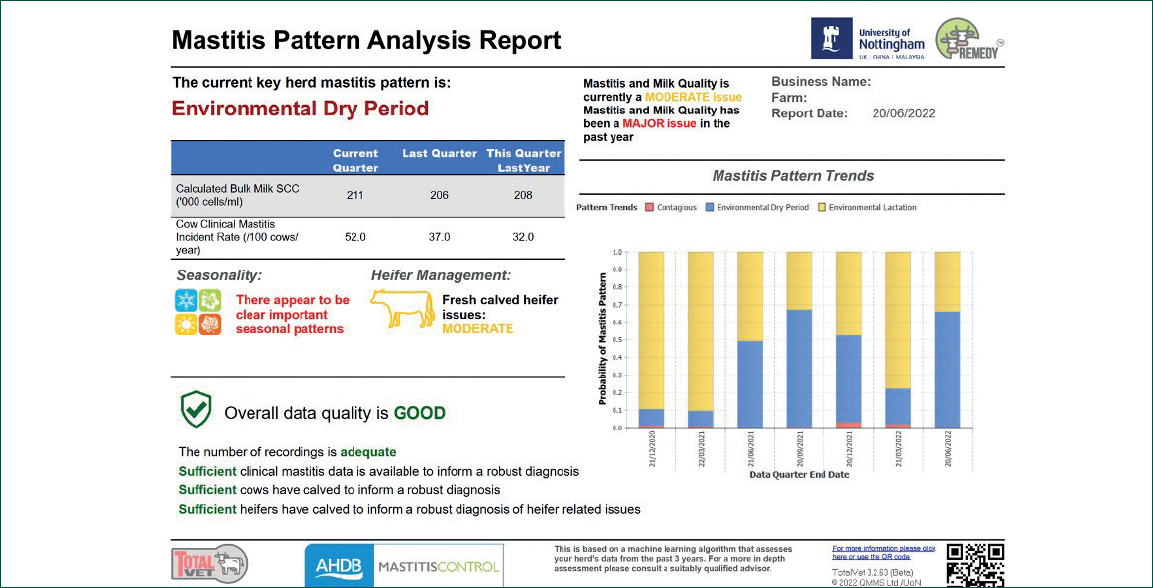
Figure 3. Mastitis pattern analysis report.
More in-depth analysis shows:
- Data quality is good — three milk recordings each quarter, sufficient calving records and clinical mastitis event data,
- The current mastitis rate is very high (52 cases per 100 cows per year)
- The dry period new infection rate is more than twice the target at 24% (target <10%, Figure 4)
- The dry period cure rate is close to target at 80% (target >85%). Some of those cows apparently ‘failing to cure’ may in fact be curing and getting re-infected
- 15% of heifers are calving in with a high cell count, i.e. new infections in heifers
- Very low rate of new infection during lactation (average 4%, target <5%)
- Very low proportion of ‘legacy’ cows, i.e. cows bringing an infection from the previous lactation.
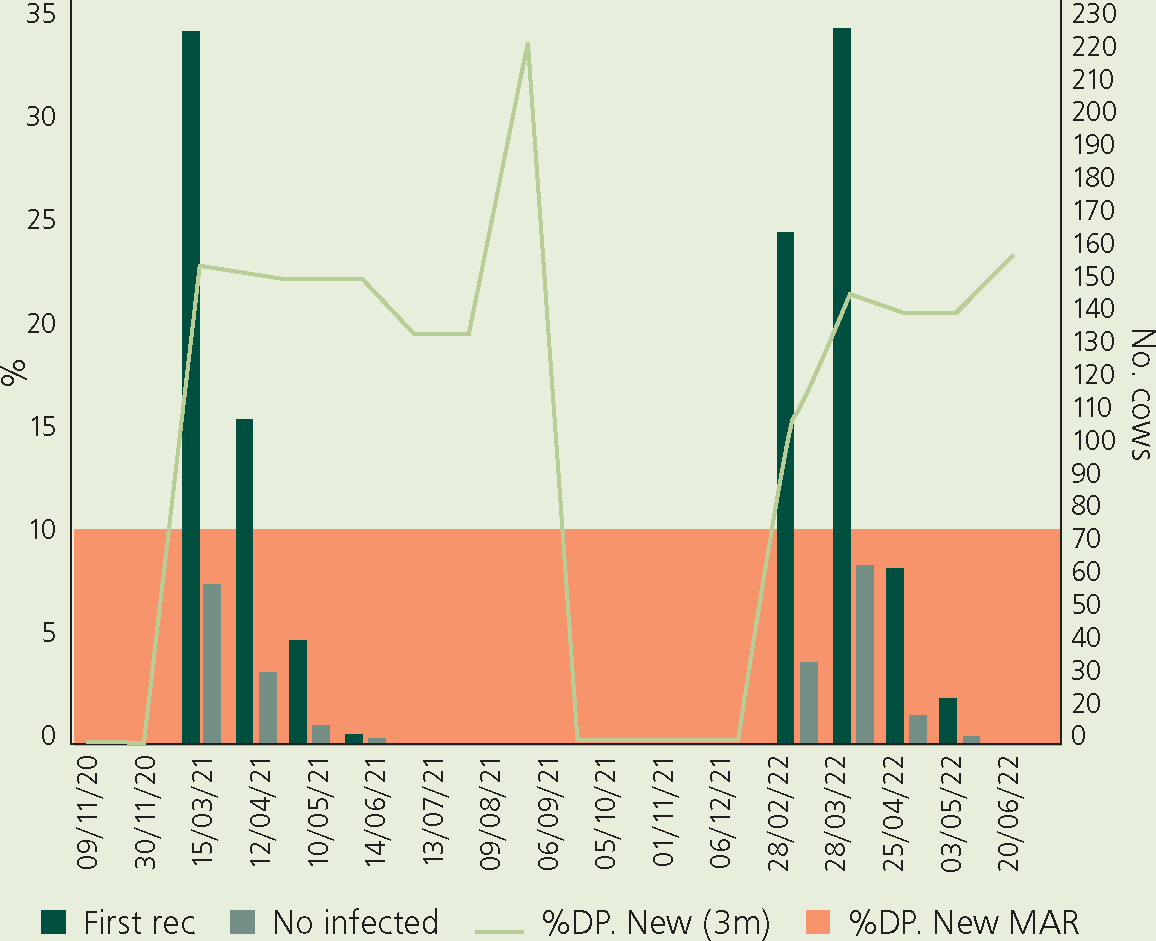
Figure 4. Dry period new infection rate for COWS ONLY (©TotalVet, QMMS Ltd). The orange zone represents the maximum advisable rate (MAR) of less than 10% of cows tested >200 000 cells/ml at first test-day post calving, having been dried off ≤200 000 cells/ml. The dark green bars report the number of these cows recorded for the first time in lactation and the grey bars the number infected — both read to the right. The light green line shows the rolling 3-month infection rate — read to the left axis.
In this case there is clear seasonality in new cell count infections, although this is focused on the calving period. These data point towards an environmental aetiology — with a high rate of new infections, but good dry period cure. Given that the rate of dry period infections is very high, but lactation new infections are well controlled, it is recommended to prioritise the dry cow environment at present. Management factors include pasture management/rotation, dry cow diet, calving area management, clean application of teat sealant etc.
Conclusions
In all cases, the automated herd mastitis pattern analysis provided by the new report will not replace a fuller diagnosis by the veterinary surgeon, but will assist in the decision-making process, and be an important ‘first step’ as well as offering an ongoing monitoring aid for udder health and mastitis control. For more information, readers should be directed towards resources on QuarterPRO and the Mastitis Control Plan.
KEY POINTS
- To be effective, any mastitis control plan needs to be based on assessment of both individual cow cell count data and clinical mastitis event data.
- Analysis of mastitis infection ‘patterns’ uses epidmiological principles to understand rates of new infection and first clincial mastitis events and their likely origin and variation.
- The new mastitis pattern analysis report uses machine learning and research from 1000 herd datasets (https://www.nature.com/articles/s41598-020-61126-8).
- Producers who are engaged with a full milk recording service can now receive the mastitis pattern analysis report free of charge via a fully automated process (https://cloud.remedy.farm/dashboard/#/signup)
- Veterinary surgeons are encouraged to help their clients sign up to this service as the first stage of the Agriculture and Horticulture Development Board (AHDB) Dairy ‘QuarterPRO’ scheme.